Jobenomics received numerous positive comments about the Functionally Unemployed mentioned in several of our recent articles (Unemployment Scoreboard: Feb 2012, and 35% “Functionally” Unemployed Rate).
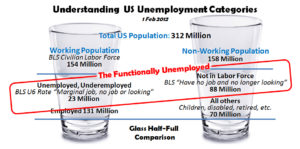
Jobenomics defines functional unemployment as the total number of underemployed, unemployed and not-in-labor-force as reported by the US Department of Labor’s Bureau of Labor Statistics (BLS). In plain English, the ranks of the functionally unemployed include US citizens currently: (1) underemployed with marginal or part-time jobs, (2) unemployed with no job yet still looking, and (3) unemployed with no job and not looking. This third category is by far the largest group as well as the group that is most overlooked and under-reported.
The Jobenomics functional unemployment number (111 million) consists of the BLS’ U6 unemployment number (23 million) and the BLS’ “Not in Labor Force” number (88 million). 111 million functionally unemployed out of a total US population of 312 million yields a functional unemployment rate of 36%.
- The BLS defines U6 as “the total unemployed, plus all marginally attached workers, plus total employed part time for economic reasons, as a percent of the civilian labor force plus all marginally attached workers.”
- The BLS defines not-in-labor-force in the following manner: “the US labor force is made up of the employed and the unemployed. The remainder—those who have no job and are not looking for one—are counted as ‘not in the labor force.’”
Jobenomics acknowledges the gray areas between working and not working, and in-the-labor-force and not-in-labor-force. For example, approximately 20 million postsecondary school (college) students are considered not in the labor force. Nevertheless, most students do not work and are being supported by either familial or government sources. This is also true of the general non-working population. If a person is able to work but is not working, that person has to be supported by someone. With the exception a few independently wealthy people, most non-workers are supported by families or government. If they are working, they are likely to be independent of government handouts and likely paying taxes to support government programs and services.

As shown above, American decision-makers, opinion-leaders as well as the American public need a complete picture of all non-workers in order to formulate a viable jobs creation, economic and welfare strategy. A nation’s economic health depends on a proper balance of the employed and unemployed. Focusing on narrowly defined groups inhibits good decision-making. To put the functional unemployment picture into better perspective, one must examine recent trends.
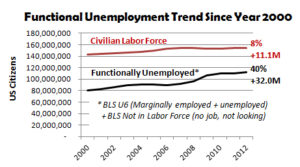
Prior to the year 2000, the civilian labor force and the functionally unemployed usually increased in unison in relation to America’s ever-growing population.

Since the year 2000, the US civilian labor force grew by 11.1 million people or 8%. During this same period of time, the functional unemployment number grew three times as fast (32 million or 40%) in relation to the civilian labor force.

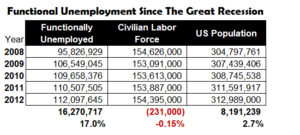
In the last five years, since the Great Recession of 2008, functional unemployment grew 17% (16.27 million) while the civilian labor force lost -0.15% (-231,000). If adjusted for population growth (8.2 million or 2.7%), the trends for the last five years would even paint a more austere picture.
If these trends continue unabated in the future, the functionally unemployed could equal the civilian labor force by 2021.
Our previous article (Unemployment Scoreboard: Feb 2012) compared the “official” U3 unemployment rate (8.3% or 12.8 million) versus the Jobenomics functionally unemployment rate. Now let’s take a look at the so-called official U1 Long-Term Unemployment Rate. The BLS defines the U1 Long-Term Unemployment Rate as “persons unemployed 15 weeks or longer, as a percent of the civilian labor force”. The U1 is currently reported as 4.9% or 7.6 million Americans. However, these 7.6 million are still looking for work. When they stop looking, they become one of the 88 million in the not-in-labor-force category, which receives little public or media attention. From a Jobenomics perspective, the number of “long-term” unemployed is much closer to 95.6 million than 7.6 million.
If America is going to solve the unemployment challenge, we must understand the scope and magnitude of the challenge that faces our nation. Jobenomics firmly believes that this growing labor force problem is largely solvable via small, emerging and self-employed business creation. The Jobenomics 20 by 20 Goal of 20 million new private sector jobs by the year 2020 includes programs for the functionally unemployed.
For skeptics who believe that people would rather handouts rather than a hand-up, Jobenomics disagrees. Our current national system of handouts, welfare and entitlement programs is essentially a non-work magnet. Without a counter-magnet, people have no choice but subsistence on the government dole, which will eventually (probably soon) run out. Jobenomics, and programs like it, provide opportunities for fellow citizens currently in the ranks of the functionally unemployed.

